Tuesday, November 19, 2013
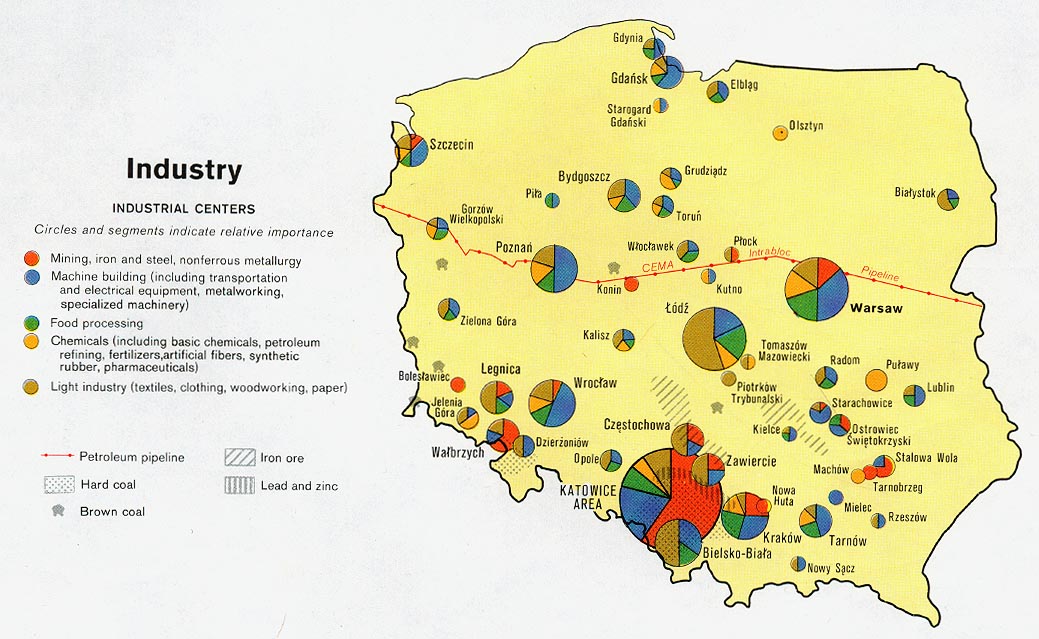
Bivariate Map Examples
The above map uses pie chart symbols to represent five different types of industry. Source: http://www.lib.utexas.edu/maps/europe/poland_ind_1977.jpg
This map is a series that shows multiple data sets. The map would be very difficult to interpret if all of the data sets were plotted on one base map. Source:http://www.library.utexas.edu/maps/islands_oceans_poles/sri_lanka_charts_76.jpg
Monday, November 18, 2013
Super Typhoon Haiyan
The above map shows the percentage of residents in the Philippines were affected by super typhoon Haiyan. The original source is Reuters National Disaster Risk Reduction and Management Council
http://l3.yimg.com/bt/api/res/1.2/nX6xoRzttj8.L_J17ju6Zg--/YXBwaWQ9eW5ld3M7Zmk9aW5zZXQ7aD04MDA7cT03OTt3PTEwNzY-/http://l.yimg.com/os/publish-images/news/2013-11-11/add9515d-335a-48d1-9f24-e7ee75fbe8c2_map_typhoon_131111.jpg
Monday, November 11, 2013
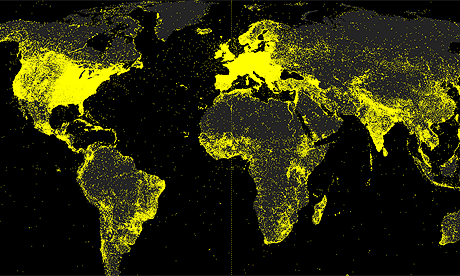
Density Map of Every Geotagged Wikipedia Article
The above image is an example of a dot density map. Each yellow dot in the map above represents one geotagged article (in English) on Wikipedia. The source website produced several of these maps that show data for different languages used.
Source: http://www.theguardian.com/news/datablog/2011/nov/11/wikipedia-map-world-languages
Thursday, November 7, 2013
Final Project Proposal
Another course I’m
enrolled in this semester is GGS 380: Geography of Virginia. In the course,
there is an ongoing assignment that requires students to write weekly field
trip reports for a specific site. For my site, I chose my neighborhood: Cardinal
Crest subdivision in Woodbridge, Virginia. Some of the topics discussed this
far were geology, hydrology, natural areas, transportation, and settlement
patterns. In each of my site reports, there’s usually at least one map. The
maps aren’t necessarily the best they can be. I’ve often had to rely on Google
Maps or the Prince William County mapper, and then adding my own “sophisticated
graphics,” as witnessed below.
The two maps above
show the elevation through the use of contour lines. The downside is that they
are a pain to interpret! Look at Figure 2 (from the Prince William Mapper);
while it’s nice to see the contours overlaying the aerial imagery, the map
seems cluttered (and has bad labeling). Figure 3 (from USGS) is cleaner, but
it’s still difficult to find the exact elevation for a specific point. I’m used
to topographical maps having a bold contour line every ____ intervals; neither
map has that interpretation aid. Another issue I've encountered when searching
for maps is that, at the scale I need, labels are sometimes nonexistent.
As our final
project for that course, we will be combining all of our site reports into one
neighborhood profile report. I want to
create a map of the neighborhood. The
intended purpose of this map is to be an all-inclusive reference map for
Cardinal Crest subdivision. While the final product will be used in another
project, residents within the neighborhood may find the map useful. When my
family decides to sell our home, the map could be provided along with other
household documents that will familiarize the new owners with the area.
My neighborhood is
actually connected to two other neighborhoods, and all three neighborhoods will
be included in the map. There are several features that will be included, at a
minimum: elevation, common areas, water features, roads, and sidewalks. Other features could be school locations, wooded
areas, property lot boundaries, parks, and certain retail establishments (like
gas stations or grocery stores). Because of the amount of data associated with
Cardinal Crest that I want to display, I’m considering doing a smaller scale
map (to show features outside of the neighborhood) accompanied by a large scale
map to show details inside the neighborhood.
The obvious first
step is gathering all of my required data. The base map will likely be a road
map imported from ArcGIS. ArcGIS Online will be my primary data source, in
addition to the stockpile of GIS data I already have. Prince William County’s
GIS department would be a logical data source; however I would rather not pay
for data.
Because the use of standard contour lines on
my example maps is so difficult to interpret, hypsometric tints would be used
on my map. One of major design decisions to make is to determine what features
should be displayed on each map. I would like to be able to show elevation
contours and wooded areas on the same map. While I would prefer to show wooded
areas using polygons, it would make the map messy and cover up the elevation
layer underneath. The best solution would be to use physiographic symbols to
represent wooded areas.
The above image is an inspirational map for this assignment. Source: http://www.stone-crossing.com/images/03-06update/wood_sc_neighborhood_map4.jpg
Subscribe to:
Comments (Atom)


